To get the characteristic of small atmospheric ions quantity there was used the method, which included periodic alternation of limited mobility of simple condenser, through which the air stream passed. According to mobility there was calculated the distribution of ions quantity. The structure of distribution function changed in the course of time. In this work there was discussed the idea that the ions, which were usually called small atmospheric ions, were distinguished into two groups: small ions or cluster ions with mobility from 1,5 up to 2,5 cm*sec-1/ volt*cm-1, and transformed small ions with mobility from 0,3-0,5 up to 1-1,5 cm*sec-1/volt*cm-1. This conception removes all difficulties concerning the mobility of small ions. It was very interesting to examine the small atmosphere ions in such way, on the conditions that were observed in atmosphere, i.e. in the presence of factors that influenced pure small ions. This research confirmed the results that were got earlier, in spite of the difficulties with measurements connected with irregular changes of examined ions concentration.
Introduction
Ions existing in atmosphere air are very interesting in many respects. The states of atmosphere connected with the characteristic of ion quantity are often determined by the values of ion quantity in cubical centimeter of air. And in most cases in addition to concentration there are also indicated the characteristics of ions themselves- small, medium and large ions. However, our knowledge of atmosphere ion properties is very poor. One of the characteristics of ions that can be measured is their mobility L. But there are some difficulties concerning the measuring of ions mobility. One of the main difficulties is the abrupt change of atmosphere ions concentration. The simplest and the most frequently used method of small atmosphere ions mobility determination is the simultaneous measuring of conduction and density of ions. If we suppose that ions have a definite discrete value of mobility k, so this mobility can be defined from the formula:
L=nke, where e - is an elementary charge.
This equation was recently used to calculate the small ions mobility according to data got from the ship, in order to process the results of measurements, which were made in Puna (India) in 1935-37 and to determine the average mobility according to measurements made in New York and its suburbs. It is obvious that the received mobility value is the average mobility, because ions contribute in conduction in case if they have different mobility and exist in different concentrations.
We were encouraged with the results of research concerning the distribution of different laboratory ions mobility. The results were got using method of periodical alternation of the chosen limited mobility for ions counter in the air stream, also we tried the same method for study of small atmospheric ions. It was obvious that it couldn't be used at all states of atmosphere in consequence of abrupt concentration changes in different weather conditions. Calm summer nights of Uppsala seemed to be very suitable for our measures, because it was found out that during these nights the quantity of ions increased thanks to accumulation of radioactive substances in lower atmosphere. We also tried to use this method under some other conditions. We failed to get results suitable for working when blew south and south-west winds because the quantity of ions was very low and there were a lot of changes at such weather. At northwest winds the state of atmosphere was quite steady, concerning the presence of ions and on basis of measurements there were made some results. Then we would describe the results of small atmospheric ions quantity measurements during the calm summer nights in Uppsala.
Results of measurements
During the summer of 1952. The suitable weather conditions were not often observed. In some cases conditions that seemed to be suitable in the beginning of measurements changed during the night and that was why we were managed to do only part of the necessary measurements.
7-8 July 1952, Uppsala, Sweden.

The weather conditions were the most suitable for measurements. On the 7th of July above Northland there appeared an area of high pressure, which dislocated to northeast. A wonderful warm weather settled on the whole territory of the country. On the 8th of July the area of high pressure above Northland disappeared, but it was expected that the dry and warm weather would hold on some days.
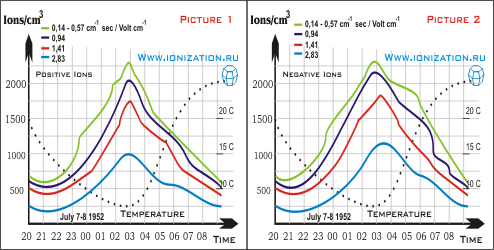
The results of researches were represented on a picture (the diagrams for positive and negative ions). There were isolation losses expressed by effective quantity of ions. As it was already mentioned these curves characterized the concentration of radioactive substances in the air. On the diagram there were indicated concentration changes of ions with different mobility depending on time and temperature. The maximal concentration was indicated at about 3AM. Simultaneously with it there was the lowest temperature - 7°C and the sunrise began. The concentration of different mobility of ions was marked in different colors.
Curves of ions quantity.
Quantity of ions for three lower fixed limits of mobility K*=0,14, 0,32 and 0,57 are equal, with the exception of differences in some points and during the decrease of negative ions concentration after the sunrise. This fact displays that the used lower values of K* mobility are in the area of saturation. The range of available mobility is quite wide. It begins from 0,4-0,5 cm*sec-1 / volt*cm-1 and reaches the value of 2 cm*sec-1/ volt* sec-1 for positive ions. The upper limit of negative ions mobility is 2,5, and in some cases a bit larger. This fact is not shown on the picture, but columns of high value of mobility are increased so that they include the quantity of ions with higher mobility. The function of distribution can be divided into two components. One includes the ions of low mobility, another - the ions of high mobility. In some cases the characteristics of the function meet such division. Usually the component with low mobility exceeds the high mobility component.
7-8 August of 1952, Uppsala, Sweden.

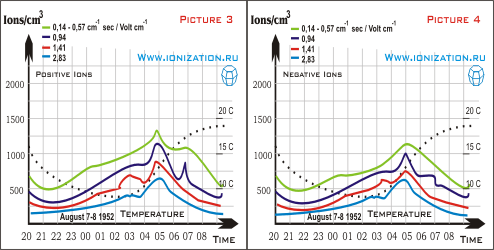
The weather conditions were not very good for observations. On 7th of August the area of low pressure, which situated above the central part of Norrland, moved to northeast together with precipitation zone. The other area of rains above the Netherlands and north part of West Germany moved to the south of Sweden. (On the 8th of August there was observed a cold northwest wind with a shower and it was especially tangible at the second part of the day. Local weather conditions would be described later). At 7PM there was a light northeast breeze, it was cloudy. The sunset was clear; at 9.20PM there was a light northeast breeze and big cumulus clouds in the west; at 9.45PM there appeared a halo around the moon. On 8th of August at 2.45PM there was a slight east breeze, there was a fog in the Fyris valley and a bright halo around the moon; at 4.05AM the fog from the valley distributed to the upper layers of air, and there was a slight north and northeast breeze, sunrise hidden in the fog; at 4.12AM the fog thickened near the ground. At 5AM there was a thick fog everywhere; at 5.10AM the density of fog increased. At 5.40AM the fog was light already, and at 5.47AM the fog disappeared entirely. At 8.28AM there were observed big and stratus clouds, and cloudiness heightened gradually. At last the sky was covered with clouds.
Comparing curves of 7-8th of July and 7-8th of August we could see differences by saturation level. During the experiments of 7-8th of August the saturation was not achieved and its absence was especially visible at last morning hours. During this night there should be high concentration of ions with low mobility. In spite of derivations in some points it was vivid that curves, made by experimental points, gave us an adequate description of atmosphere concerning the presence of ions. The mentioned derivations could be explained if to take into consideration the greater changes in concentration of ions as were observed, for example, in other series of measurements, especially during bad weather conditions.
Actually, in this case, conditions were not very good. Movements of temperature and relative humidity were described on picture 4. At night from 7th to 8th of August the amplitude of temperature curve was less than the half of the amplitude of night from 7th to 8th of July. The concentration of ions was also about twice less. This fact also pointed out how difficult it was to make experiments on 8th of August.
Discussion
Measurements examined above showed that it was possible to determine the mobility of small ions of atmosphere air if there were good weather conditions. Calculated mobilities were not constant, in the course of time they changed within some limits. Moreover, we could make the conclusion that air ions differ in mobility, which value was distributed to some range.
Definitions and facts
Classification of atmosphere ions is based on their mobility, the only characteristic, which can be measured for certain. Usually the ions of gas we consider as the atom or molecule with deficiency of one or more electrons in external electron layer or layers (positive ion) or one and more additional electrons in external electron layers (negative ion). Such ions that are called atomic or molecular ions can be observed in pure gases at low pressures, and these ions are very well studied.
However, if these ions appear at high pressure (for example, atmosphere pressure) they live just a split second and their mobility lowers till 1-2 cm*sec-1/volt*cm-1. One of the explanations of this decrease is based on the supposition that when the simple molecular ion appears in gas with high atmosphere pressure, other molecules combine with it and form cluster ions.
The use of results
On picture 1 and 2 we see that concentration of ions decreased and ions with high mobility predominated there. There were formed the new ions, which could not transform into reformed small ions so quickly. Towards the end of series the contribution of reformed small ions to the function of distribution increased again.
The significant quantity of ions, which appeared after the sunrise could be explained with the fact that, as it was shown at similar weather conditions in earlier experiments, at that time there could be observed the decrease of large ions concentration, and concentration of radioactive substances in the air could be increased with the increase of nucleuses concentration. Similar tendencies could be observed on pictures 3 and 4, but in this case the groups of initial and reformed small ions were divided, because the measurements were made with the larger resolving capacity. There also were observed some intermediate ions in the area of lower mobilities. Declinations from the general rule took place because of the weather conditions that worsened the quality of measurements. While the form of the curve did not change in general. It was defined that initial ions could be transformed from the research of ions that were formed at corona discharge.
Conclusions
As we see, with the sunrise the concentration of ions lowers, the peak of the largest concentration is observed just before the sunrise. Simultaneously with the sunrise the temperature also increases. As a result on the concentration and the spectrum of ions influence a lot of factors, such as humidity, temperature, some other weather conditions. The concentration of different spectrums of mobility is not constant, because it depends on external influences. Moreover, the quantity of positive and negative ions is nearly the same, but according to diagrams we see that curves have characteristic differences.
The article was edited by Aydar Tuktagulov and expanded from Uppsala University


